Health Checks in .NET: this simple tool can save your production (and your nights)
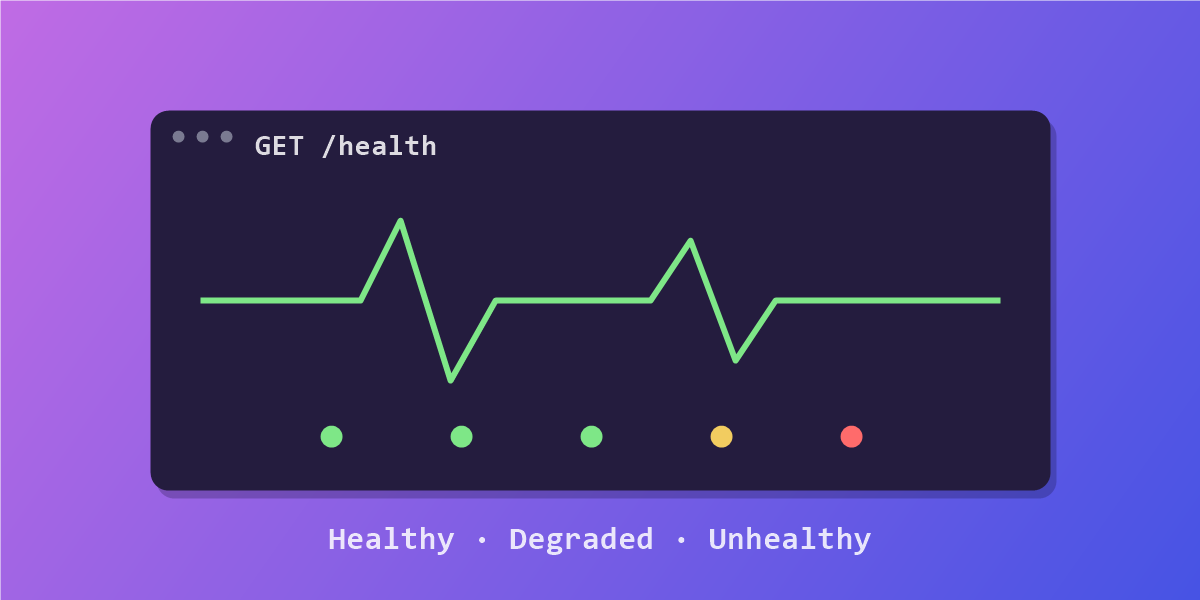
Picture this: your database is down, and you only find out when your users call support.
Or you depend on an external API that stops responding without you knowing. Your disk fills up, and your services crash without warning.
Health Checks change all of that: you're informed in real time and can react before users are impacted. In under 10 minutes, I set up a complete system in my application to monitor my critical services.
What you can monitor
Databases: check that your read and write databases are reachable. External APIs: monitor connectivity to third-party providers (Datadog, for instance). System: available disk space, memory usage, network latency. Plus: message queues, and even your business rules.
The packages
I use several, because I configured specific checks to cover different needs:
AspNetCore.HealthChecks.Network
AspNetCore.HealthChecks.SqlServer
AspNetCore.HealthChecks.System
AspNetCore.HealthChecks.UI
AspNetCore.HealthChecks.UI.Client
AspNetCore.HealthChecks.UI.InMemory.Storage
AspNetCore.HealthChecks.Uris
Microsoft.Extensions.Diagnostics.HealthChecks
Code side: Program.cs
builder.Services.ConfigureHealthChecks(builder.Configuration);

var app = builder.Build();

app.MapHealthChecks("/health", new HealthCheckOptions
{
    ResponseWriter = UIResponseWriter.WriteHealthCheckUIResponse
});

app.UseHealthChecksUI(options =>
{
    options.UIPath = "/healthcheck-ui";
});
Centralized configuration
A HealthCheckExtensions extension gathers all the checks:
public static void ConfigureHealthChecks(this IServiceCollection services, IConfiguration configuration)
{
    var connectionStrings = configuration.GetSection("ConnectionStrings").Get<ConnectionStrings>();
    services.Configure<DatadogSettings>(configuration.GetSection("Datadog"));

    services.AddHealthChecks()
        .AddSqlServer(connectionStrings.ReadDatabase,
            name: "SQL Server - Read Database",
            failureStatus: HealthStatus.Unhealthy,
            tags: new[] { "database", "read" })
        .AddSqlServer(connectionStrings.WriteDatabase,
            name: "SQL Server - Write Database",
            failureStatus: HealthStatus.Unhealthy,
            tags: new[] { "database", "write" })
        .AddCheck<DatadogHealthCheck>("Datadog API Monitoring",
            failureStatus: HealthStatus.Degraded,
            tags: new[] { "monitoring" })
        .AddPrivateMemoryHealthCheck(
            maximumMemoryBytes: 1024L * 1024L * 1024L,
            name: "Private Memory Usage (1GB Limit)",
            tags: new[] { "system" })
        .AddDiskStorageHealthCheck(
            options => options.AddDrive("C:\\", 1024),
            name: "Disk space",
            tags: new[] { "system" })
        .AddPingHealthCheck(
            options => { options.AddHost("8.8.8.8", 100); },
            name: "Network Latency (Google DNS)",
            tags: new[] { "network" });

    services.AddHealthChecksUI(setup =>
    {
        setup.SetEvaluationTimeInSeconds(60);
        setup.MaximumHistoryEntriesPerEndpoint(60);
        setup.AddHealthCheckEndpoint("api", "/health");
    }).AddInMemoryStorage();
}
Checks are evaluated every 60 seconds, the last 60 results are kept per endpoint, and everything is exposed on /health.
A custom check: the Datadog API
Reading Datadog's documentation, I found a dedicated endpoint to verify their API is operational. External API providers usually offer this kind of route, you can apply the same method to any external API by adapting your check:
public async Task<HealthCheckResult> CheckHealthAsync(
    HealthCheckContext context, CancellationToken cancellationToken = default)
{
    try
    {
        var uri = new Uri(_settings.HealthCheckApi);
        var response = await _client.PostAsJsonAsync(uri, new[] { checkData }, cancellationToken);

        return response.IsSuccessStatusCode
            ? HealthCheckResult.Healthy()
            : HealthCheckResult.Unhealthy($"Datadog API returned {response.StatusCode}");
    }
    catch (Exception ex)
    {
        return HealthCheckResult.Unhealthy("Failed to connect to Datadog API", ex);
    }
}
The UI and the alerts
Everything is visible in a clear interface thanks to HealthChecksUI (/healthcheck-ui): status of each check, duration, history. When a check fails, the description tells you exactly what's wrong, "Datadog API returned Forbidden", "minimum configured megabytes for disk C:\ is…".
And to be alerted without watching the UI: email notifications (SMTP), Slack / Teams, webhooks to your own services, or integrations with tools like Datadog, PagerDuty or Opsgenie.
Takeaway: stop letting your users be your production testers. A few lines of code give you a live overview of your services, and the peace of mind of reacting fast.
This article comes from one of my LinkedIn posts (in French), join the discussion ↗